Social Media in Medical Education: Embracing a New Medium
27/08/2012A full quarter of people use second screens while watching TV – Deloitte
27/08/2012Infographic Post vs Traditional Post, Social Media Performance
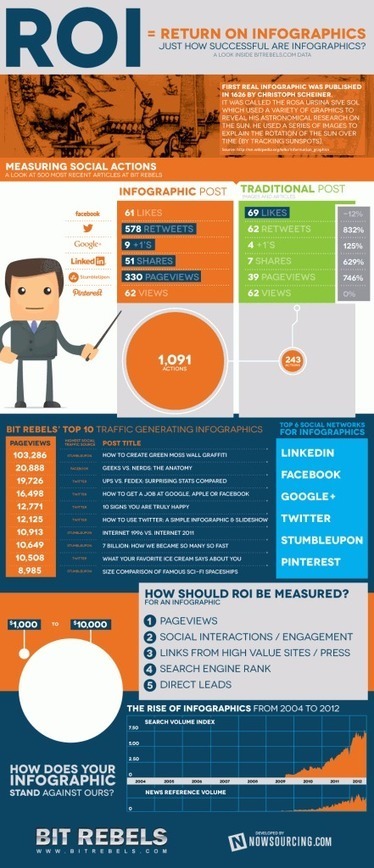
Trivia: First infographic was created by Cristoph Scheiner in 1612(wow!) where he used a series of images to explain the rotation of the sun over time.
Social Media Stats(Infographics Post vs Traditional Post):
– Facebook: An infographic posts received 61 likes while a traditional post 69 likes. Thats about 12% less likes for the Infographic post.
– Twitter: The infographic post was retweeted 578 times while the tradional post received only 62 retweets, making the Infographics posts 832% more popular over the traditional post.
– Google Plus: Infographic most was more popular within Google Plus users receiving 9 +1′s while traditional one received 4 +1′s, thats a 125% increase.
– LinkedIn: Again Infographic was the winner getting shared 51 times, about 629% more than the traditional post shares(7 shares).
– Stumbleupon: SU generated 330 pageviews for the infographic post while the traditional one got 39 pageviews. Infographics once more was more popular by 746%.
– Pinterest: Newly born social media of Pinterest created the same amount of views(62 views) for both type of posts Infographic and traditional one.
Top 6 Social Networks for Infographics:
– LinkedIn
– Facebook
– Google+
– Twitter
– Stumbleupon
– Pinterest
See on www.makis.tv